Correctional Populations in the United States, 2021 – Statistical Tables
Second Chance Month
April 2023
Written
Topic:
Research & Statistics
Correctional Populations in the United States, 2021 – Statistical Tables
This report from the U.S. Department of Justice's Office of Justice Programs, Bureau of Justice Statistics summarizes data on populations supervised by probation or parole agencies and those incarcerated in state or federal prisons or in the custody of local jails. It presents data on the number of persons supervised by adult correctional systems from 2011 to 2021 and on their correctional status (i.e., in prison, in local jail, on parole, or on probation). The report also has new tables on sex and race and ethnicity of persons supervised by correctional systems.
Highlights from the report include:
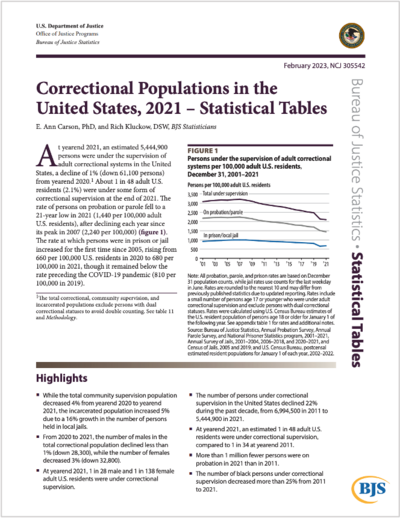
- At yearend 2021, an estimated 5,444,900 persons were under the supervision of adult correctional systems in the United States, a decline of 1% (down 61,100 persons) from yearend 2020.
- The rate at which persons were in prison or jail increased for the first time since 2005, rising from 660 per 100,000 U.S. residents in 2020 to 680 per 100,000 in 2021, though it remained below the rate preceding the COVID-19 pandemic (810 per 100,000 in 2019).
- While the total community supervision population decreased 4% from yearend 2020 to yearend 2021, the incarcerated population increased 5% due to a 16% growth in the number of persons held in local jails.
- From 2020 to 2021, the number of males in the total correctional population declined less than 1% (down 28,300), while the number of females decreased 3% (down 32,800).

![]()
![]()

©NRRC 2024 — Privacy policy